
Data is always physical
The illusion of abstract data, COVID's uneven toll, and a WebGL music visualizer

It’s hard to focus these days. Harder than normal, I mean (when was the last “normal”?). I periodically try to remind myself why I keep writing this newsletter in the first place.
I don’t have much to say about it right now other than this: it feels like excercise. Like running, or calisthenics. I don’t always want to do it, but it forces me to work my mental muscles of curiosity. So in the face of a lingering pandemic, the war in Ukraine, and the various anxieties of modern life, I’m trying to hop on the proverbial treadmill once in a while.
Many people are writing many words about Ukraine. I am ill-equipped to do so, so I won’t, other than to say 1) war is terrible, 2) imperialism, also terrible, and 3) if you want to help Ukrainians please pay attention to sources and groups asking for money. A credible list for helping refugees can be found here. If you just want to learn more about the conflict in Ukraine, this chart explainer is a good start.
A data sonification release
Last Friday I released a project that I’ve been brewing on for a while. It’s a collaboration with Loud Numbers, the original (pretty sure?) data sonification podcast, in which I created a remix of their episode titled “End of the Road”.

Technically speaking, it’s actually a re-sonification as well. Using the same dataset that built the foundation of the original track, I mapped various data parameters to custom synthesizers, samples, and field recordings to create a new interpretation.
The process was challenging but also creatively refreshing. So much so that I wrote this short-ish post on my notepad explaining how I made the piece. This write-up also acts as “liner notes” for the song, so if you want to know what each sound in the track represents, read it before listening. Sort of like a chart legend, but for audio.
The remix will be featured on a full compilation album of Loud Numbers remixes coming this summer, so stay tuned!
You can listen to the full track below via Bandcamp, or if the embed isn’t working, click here.
Read

Data is never abstract
We (myself included) have a tendency to talk about data as this abstract, complex thing. But through a new exhibition titled “New Elements” (and in this interview), Dietmar Offenhuber questions this notion by instead centering data firmly in the physical realm:
'“…a datum or data point may be defined as the difference between two states of existence, always a measurable relationality. With this, data is actually defined as a tangible object — the physical world is therefore an analog computing machine.”
Lots to chew on here. But I think the most interesting strength of this viewpoint is its emphasis on the physicality of data, how it is rooted and embodied in the phyiscal world. What we think of when we hear the word “data” (tables, visualizations, AI, etc.) are the abstracted layers on top of the physical. A subtle shift, but I think when taken into practice, can provide much more empathy when working with datasets.
Explore
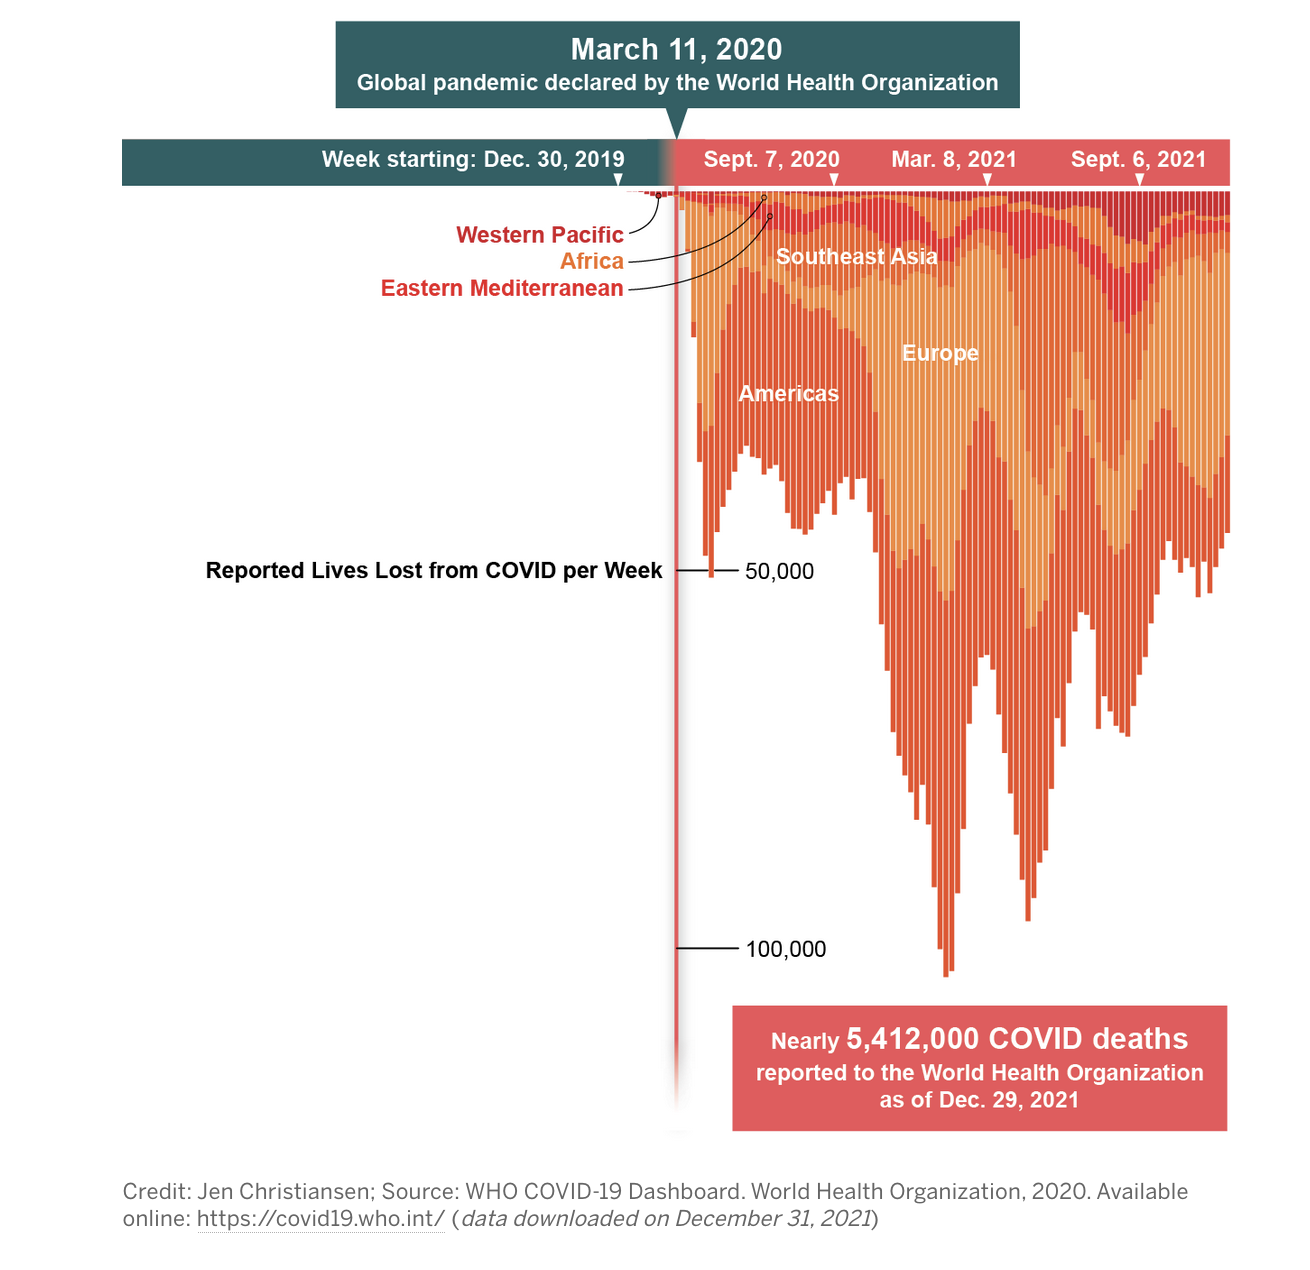
COVID’s Uneven Toll Captured in Data: Visualizing ongoing stories of loss, adaptation and inequality
Scientific American compiled a truly impressive collection of charts that document how COVID changed everything, from life expectancy to mental health disorders to carbon emissions. The style here is stark, minimal. I like the common use of slope charts to show “before/after” comparisons to put things in perspetive.
Learn
Make a music visualizer with THREE.js & Web Audio API
Full disclosure, I have not done this myself yet. But this tutorial from Prakhar Bhardwaj has been in my bookmarks for a while. After dabbling in Web Audio myself the past few months, I’m eager to find new ways of combining audio and visuals in the browser. Seems like a good place to start!


