
Feeling data
The aesthetics of data empathy, a Book of Life, and ASMR network maps

Hello and welcome to the first Data Curious newsletter of 2022! I do this part every year as a practice in accountability: as a reminder you receive this email weekly (honestly, whenever I feel like sending it out) because you subscribed to it via email. If this newsletter no longer interests you, then unsubscribe at any time via the link at the bottom. No hard feelings! Disclaimer complete.
I’m back to writing about what I have been captivated by recently. Specifically, things that are made with, inspired by, or curated through some form of data. This week I have three very strong (re: inspiring? dope?) essays that I’m excited to share with you.
Over my holiday hiatus, I spent a lot of time not at my computer, which was explicitly the point. As is customary, I did some reflecting on what this year might look like for me. Still mulling that one over. But for sure, I’d like to spend more time creating and publishing art, in whatever form that might take, in 2022.
To that end, I have decided to take a “learn in public” approach to various forms of art making via the humble Twitter thread. Low stakes, quick outputs.
Inspired by some other online friends sharing their creative experiments (s/o to Duncan Geere’s #100daysofmodular thread), I decided to start some of my own. This year, in an effort to learn more about block relief printing, and also to engage in a purely analog/offscreen form of art making, I’m embarking on 100 days (roughly…more like 100 unique prints) of linocut stamping/printing and sharing them in the thread below.
Day 9 of #100daysofblockprinting - another mountain peak from scraps! Using lines to replicate shading on different "sides" of the mountain. Learning that printing in one color can force you to think outside the box in order to add detail, in a nice way! #blockprint #linocut
— Ben Dexter Cooley (@BenDexterCooley) 3:17 PM ∙ Jan 12, 2022
Also, as is customary for the GenArt scene on Twitter in January, I’m dabbling in #Genuary2022 this year. Two years ago I did a similar thing with #Codevember by posting a code sketch for every prompt/day of the month. I found the experience exhausting, but also rewarding. I learned a lot through the process. For this Genuary, I’ve decided to take a more lax approach, creating sketches for the prompts that really interest me, or that I have time for. No need to check all the boxes. My intermittent attempts at Genuary prompts can be scanned in this Twitter thread:
day 09 of #genuary2022 - Architecture. Inspired by @shiffman sketch, I made my own generative cityscapes with random sunset gradients! This one was fun #genuary #generativeart
— Ben Dexter Cooley (@BenDexterCooley) 3:01 PM ∙ Jan 11, 2022
Inspo:
So far it’s been fun to share quick ideas that I create. Although there is always the risk that I commit too much time to an idea that really isn’t going to go anywhere, I like the idea of carving out space for creative play. More updates to come on that in the future.
And now, here are some cool things to think about this week.
Read
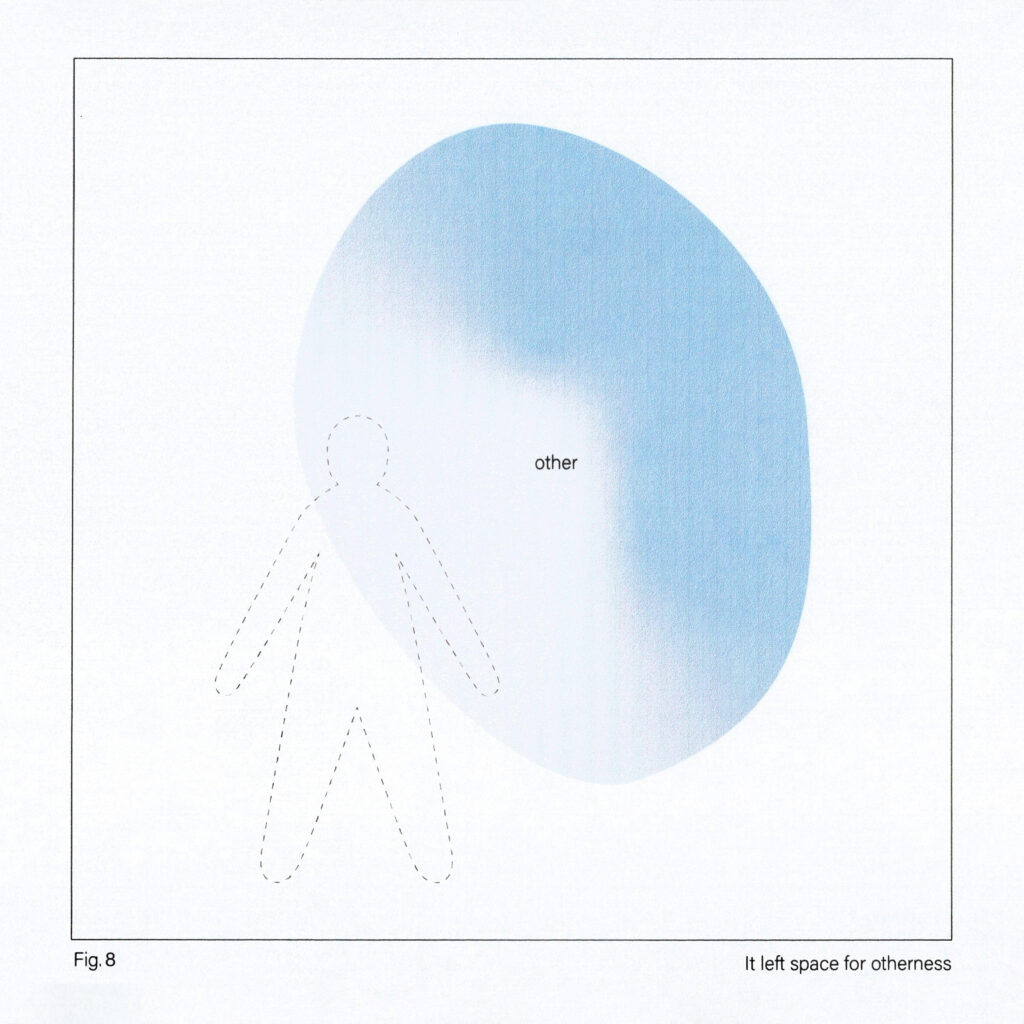
Feeling Data: Aesthetic Empathy in Art and Science Collaborations
This article from artist and writer Emily Dzieweczynski is one of the most profound and stimulating interpretations of working with data that I have come across. I highlighted so many excerpts in Instapaper that I half-considered just copy/pasting the entire article here.
Instead, I’ll try to leave a teaser in the quote below and only say this: after working in data visualization for some time, and specifically working in the sciences, I see an incredible need for the type of aesthetic and “data empathy” that Emily writes about. Our fundamental approach to data and research—as a colonial project of taking, owning, extracting—needs to change in order to create more equitable outcomes:
“Thinking about data more broadly, the words we use to refer to data processes reveal perhaps implicit truths. We take data, capture data, collect data. If language is simulated in the brain, how might these words be simulating a feeling of data that perpetuates colonialism and ownership over the natural world? While the verbs we choose to use in tandem with data may seem trivial, they clearly illuminate how data can be exploitative—neglecting the very populations that the research affects.”
Read the full article here.
Explore
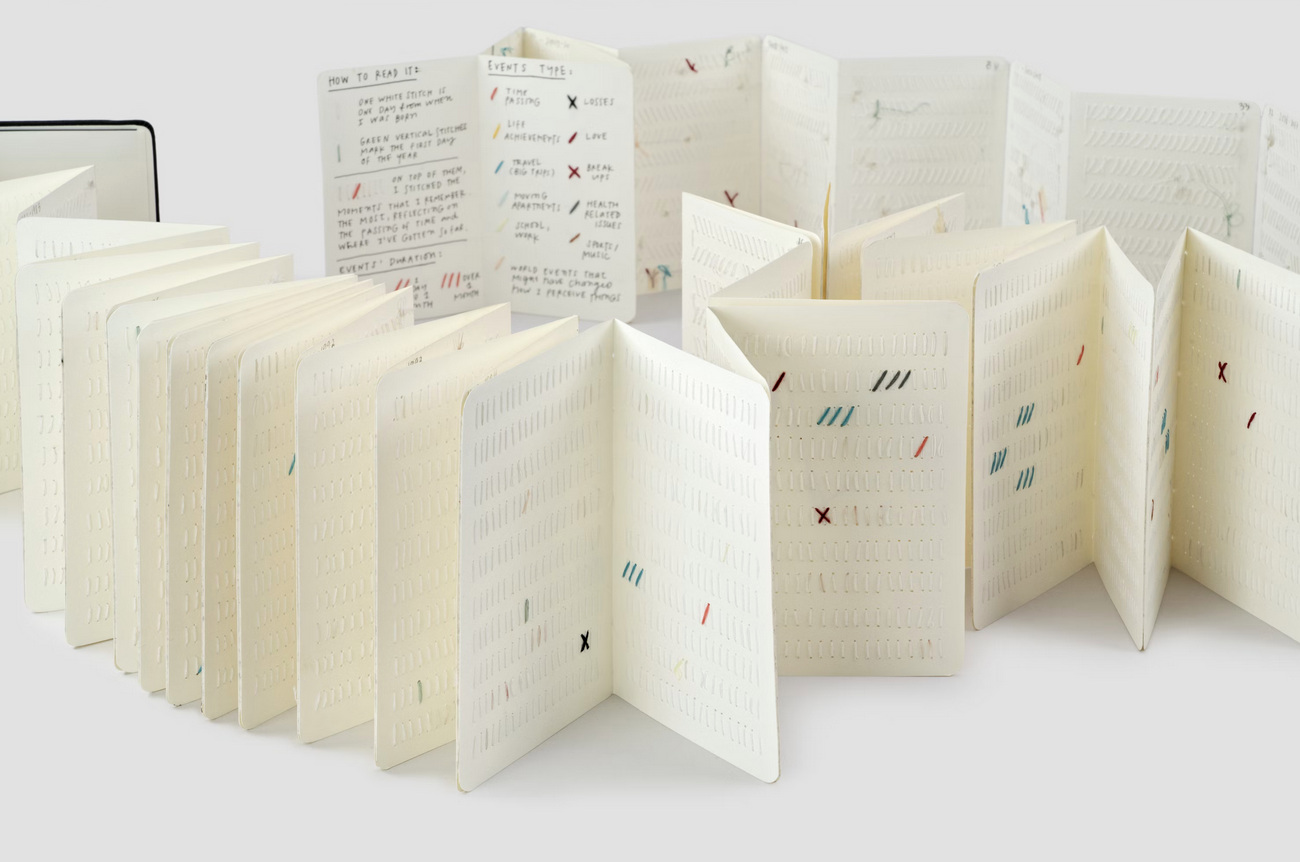
Giorgia Lupi’s Book of Life for the Moleskine Foundation
In response to the prompt “What comes first?”, data artist Giorgia Lupi created a hand-stitched notebook cataloging her life:
To begin, she disassembled three Moleskine notebooks, then re-assembled their pages in an accordion. She then stitched the pages with thread––14,496 stitches to be exact, one for each day of her life up until that point.
Each colored stitch represents a different type of event. The craft and care that went into this project is mind-boggling. There are so many challenging and inspiring ways to think about personal data in this essay:
“The notebook is a visual archive of her memories, a meditation on the individual threads that weave together to make up her identity.”
Finally, I find comfort in Giorgia’s approach to data-as-meditation. I hope you read the full essay here, but for now I leave you with this:
“I am a data observer, a data collector, and a believer that counting something means it matters. To expend time and effort with your past is a particularly potent form of self-awareness. It’s an exercise to document existence, a record of time, the happenings and places that make our lives what they are.”
Learn
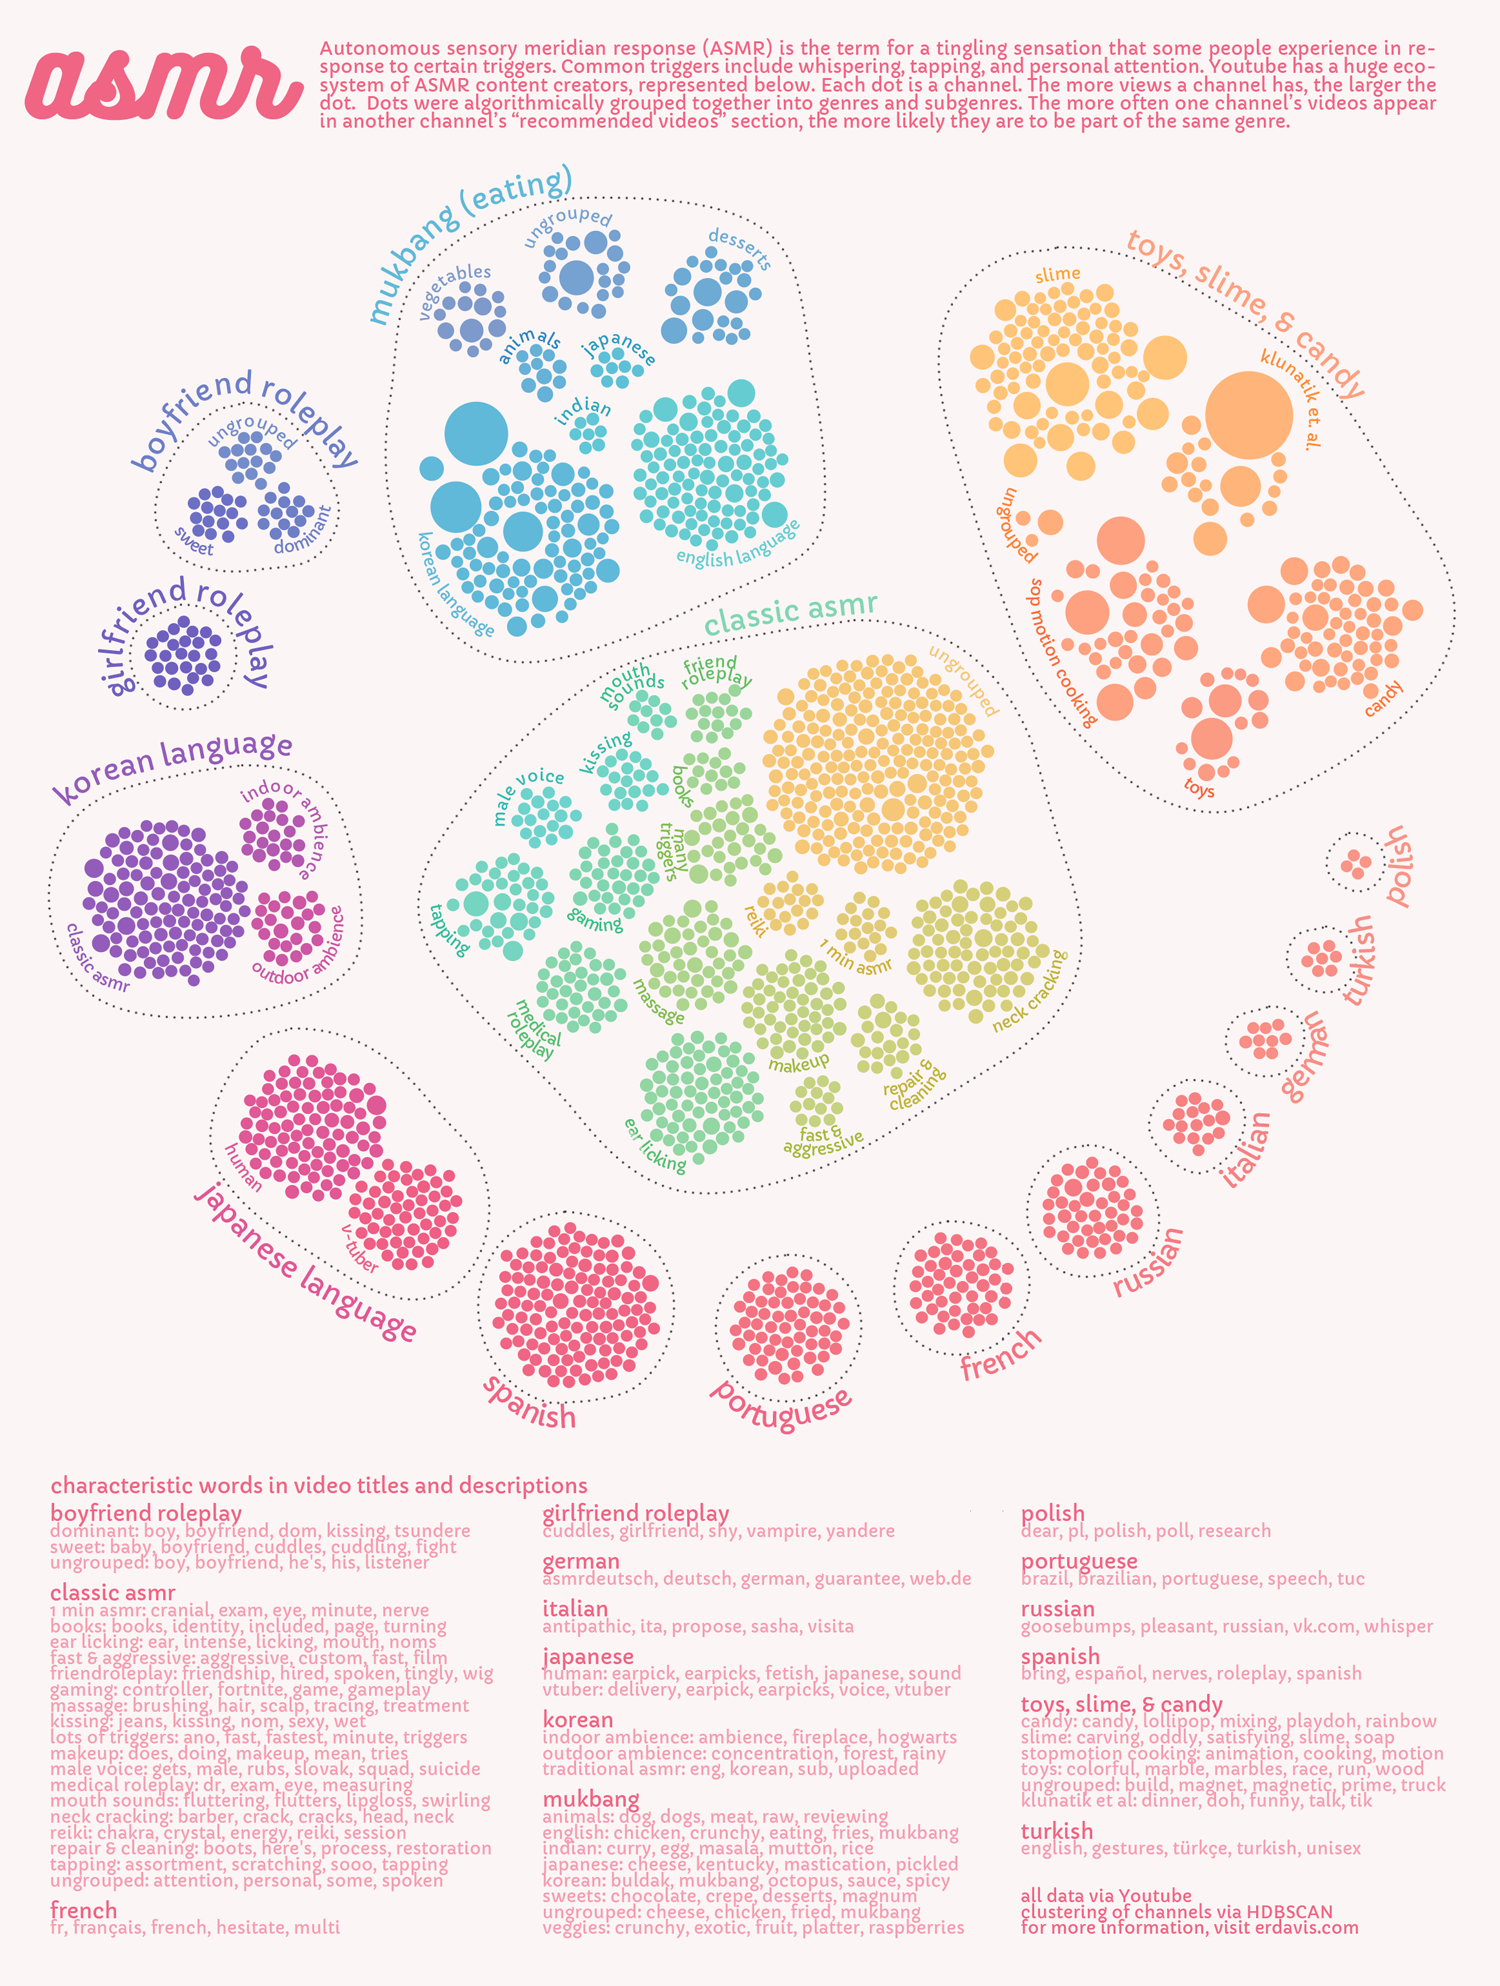
Making a network map of your Youtube watch history — via this amazing ASMR data analysis and visualization
Erin Davis makes stuff with data. Like, a lot of cool stuff. I found her most recent project write-up on how she made this ASMR video relational network to be particularly insightful. She documents the technical aspects of using Google Takeout to download her data and graph it in Gephi. But she also includes some insightful notes on the design process and reasoning behind the creation of the poster. An all around informative read and walkthrough, no matter your level of code-savviness.


