
People vs. Fossil Fuels (pt. 1)
The fight against fossil fuels comes to D.C.

This issue will be short, but with a timely message for those concerned about our collective climate crisis. I'm planning a follow-up post that contains more data behind these issues next week, but for now:
Next week is an important climate moment. Although we all will feel the impacts of climate change, the majority of the responsibility does not fall on individuals: just 20 energy firms makeup a one third of all carbon emissions.
Next week, Indigenous organizers are bringing the fight against fossil fuels to D.C. These are the activists responsible for canceling the Keystone XL Pipeline and they represent one of the most effective and committed activist groups fighting for our planet. They have a request:
If you are able to join the frontlines, join them in Washington D.C. from Oct. 11 to 15 to demand a fossil free future. Thousands will descend on the capitol to participate in civil disobedience. You can also go to PeoplevsFossilFuels.org to find out other ways to take action.
If you are not able to attend, you can support from afar by amplifying their message online, providing remote support, and donating to one of the below direct action groups:
More to come next week.
Read this
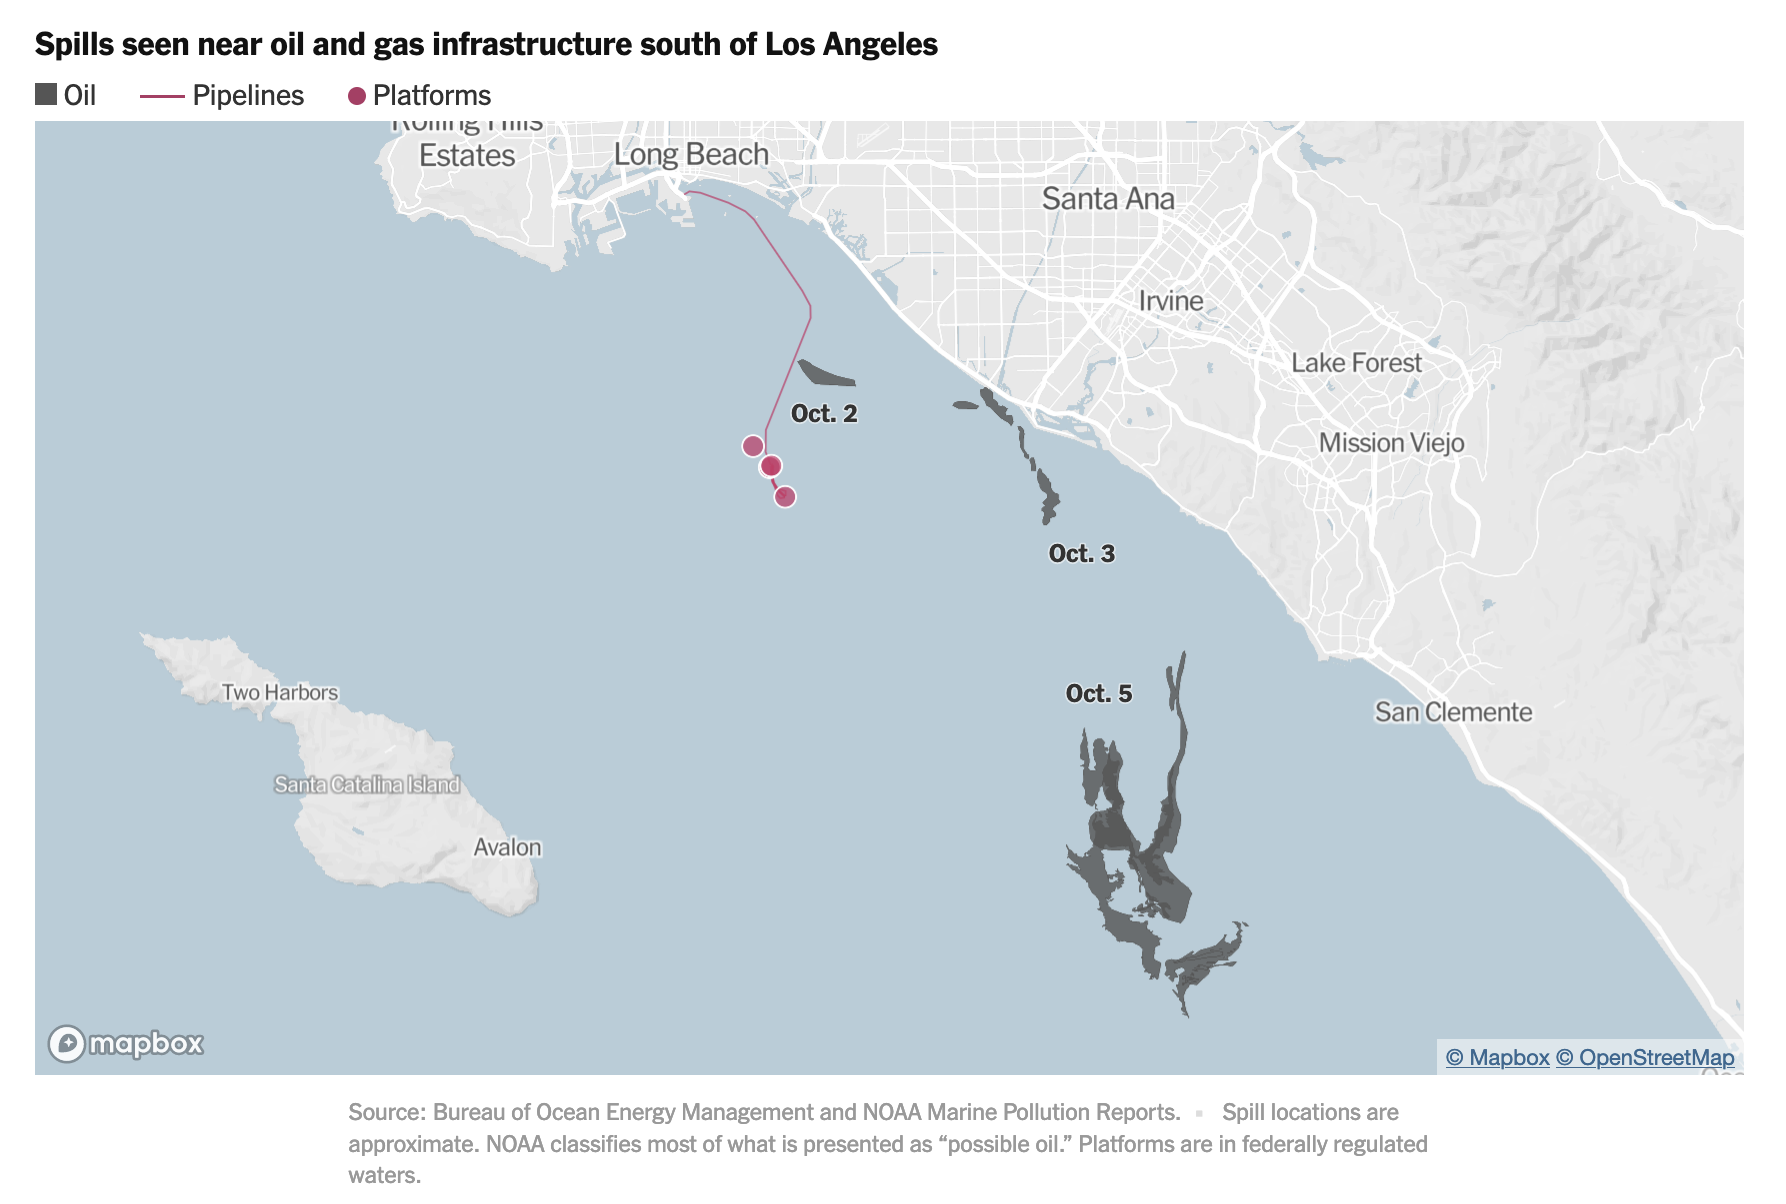
Mapping California's Oil Spill: Aging Pipes Line the Coast
Although no active drilling takes place off the coast of California, pipes installed 30 to 40 years ago are showing signs of wear. These maps provide a good visual look at the invisible networks beneath our oceans which, unless repaired or removed, present an ongoing risk of leaks.
Look at these
Data designer Valentina D'Efilippo published a series of visualizations in Scientific American exploring the impact of a) reducing food consumption and b) switching to a plant-rich diet on cutting down food waste. Currently, 40% of food produced is wasted.
🍎🐄🤯🤯
— Valentina D'Efilippo (@defilippovale) 10:54 AM ∙ Sep 30, 2021
In my last collaboration with @sciam I've learnt that an astonishing 40% of food is wasted. But the bright folks at @ProjectDrawdown show that it doesn't need to be that way.
October issue out now:
scientificamerican.com/article/massiv…
🙏Thanks to @markfischetti & @ChristiansenJen!
Yes, I know this next one is a bar chart race and people have feelings about those. But the message of this one is really crucial: The United States has been emitting the most CO2 emissions, for the longest period of time. The recent finger-pointing at China, Russia, India, etc. is scapegoating at its worst. Data shows that the US is by far the worst culprit for cumulative emissions, and this chart tells that story very effectively.
Analysis: Which countries are historically responsible for climate change? | @DrSimEvans @tomoprater
— Carbon Brief (@CarbonBrief) 5:14 PM ∙ Oct 5, 2021
Read here: j.mp/3BqY36t
Learn something new
+---------------+---------+------+----------+
|     Col1      |  Col2   | Col3 |   Col4   |
+---------------+---------+------+----------+
| Hello         | Value 2 |  123 |     10.0 |
| World         | cols    |   12 | -2,027.1 |
+---------------+---------+------+----------+
Google sheets API
Every so often I need a quick and lightweight database for a static site. Google Sheets offers an easy solution. This API library has some of the best documentation on how to access your Google Sheet programmatically.


