Collecting sounds

Hello,
This will be a shorter edition of Data Curious. It's summer, I'm juggling many projects at once, and I'd like to spend as much time in the sun by a river as possible (not here, at my computer).
Today I'll just stick to sharing three pieces of data visualization and creative coding that have stuck with me the past few months. Before that, a few updates on what I've been working on:
- I released a new album (non-data related) of ambient music and field recordings on July 17 via the record label AKP Recordings. It's called Forager and you can buy it on cassette or listen online wherever you like. If you're interested in the process of making the album (field recording, electronics, etc) I wrote a series of "field notes" as a sort of liner note companion leading up to the release (archived editions here).
- I will be performing a new original data sonification work at International Conference on Auditory Display (ICAD) in Troy, NY on July 29. If you will also be there, come say hi! My piece will be a sonification of sentiment across Wikipedia during the year 0f 2025. More details on this after it is finished and I have time to document it.
- Next week my team at Vermont Complex Systems Institute will be hosting the 12th International Conference on Computational Social Science (IC2S2). I'll be giving some talks on the new Wikipedia tool we've been developing which I've mentioned in this newsletter. That talk will likely become a blog post with details on how to use the data, which I'll share here when it's ready.
Ok, enough updates about me. Here are three pieces I have really enjoyed for you to explore! Next issue I'll try to get back to the Read / Explore / Learn format.
A Hidden Infrastructure
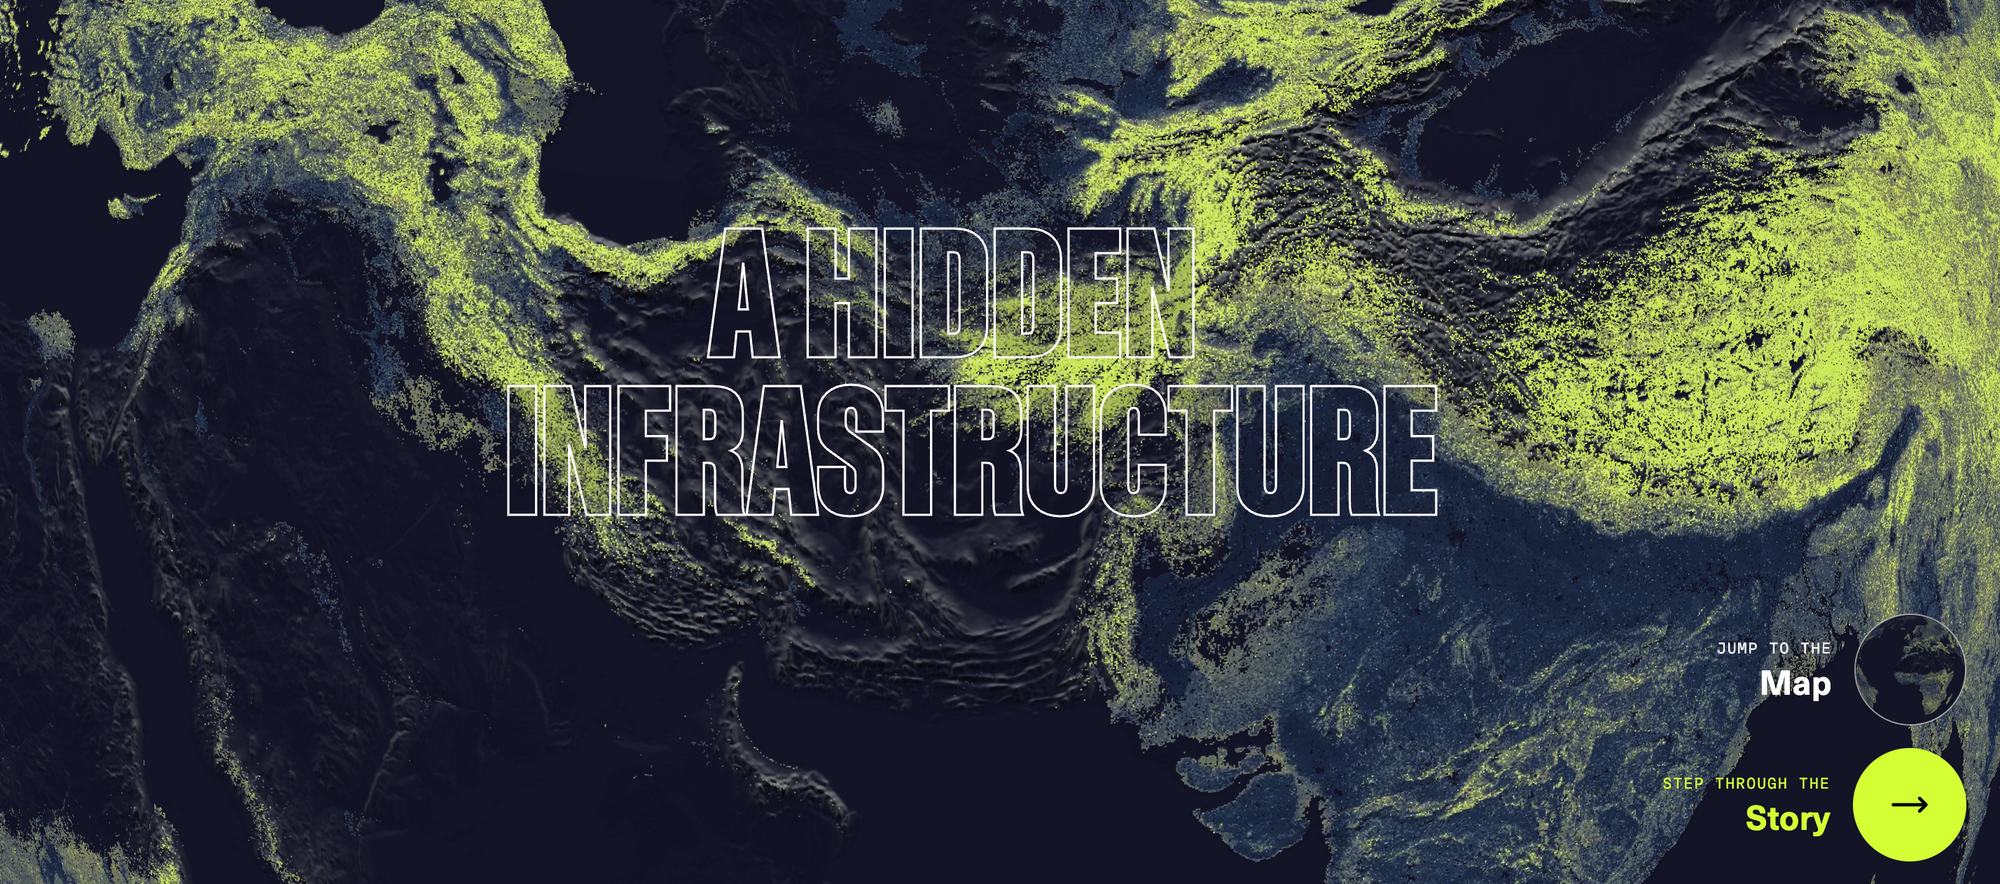
I have been fascinated by underground funghi networks ever since reading The Overstory by Richard Powers (and subsequently reading the nonfiction work that inspired parts of the novel, Finding the Mother Tree by Suzanne Simard). Mycorrhizal fungi connect 70% of all plant species. It is a vast network in the Earth to share resources, communicate danger, and send messages. This visual story and map is one of the most compelling introductions and explorations of this "hidden infrastructure" that I've seen. I like the "step-through" story method here instead of scrolling too.
The Seinfeld Chronicles
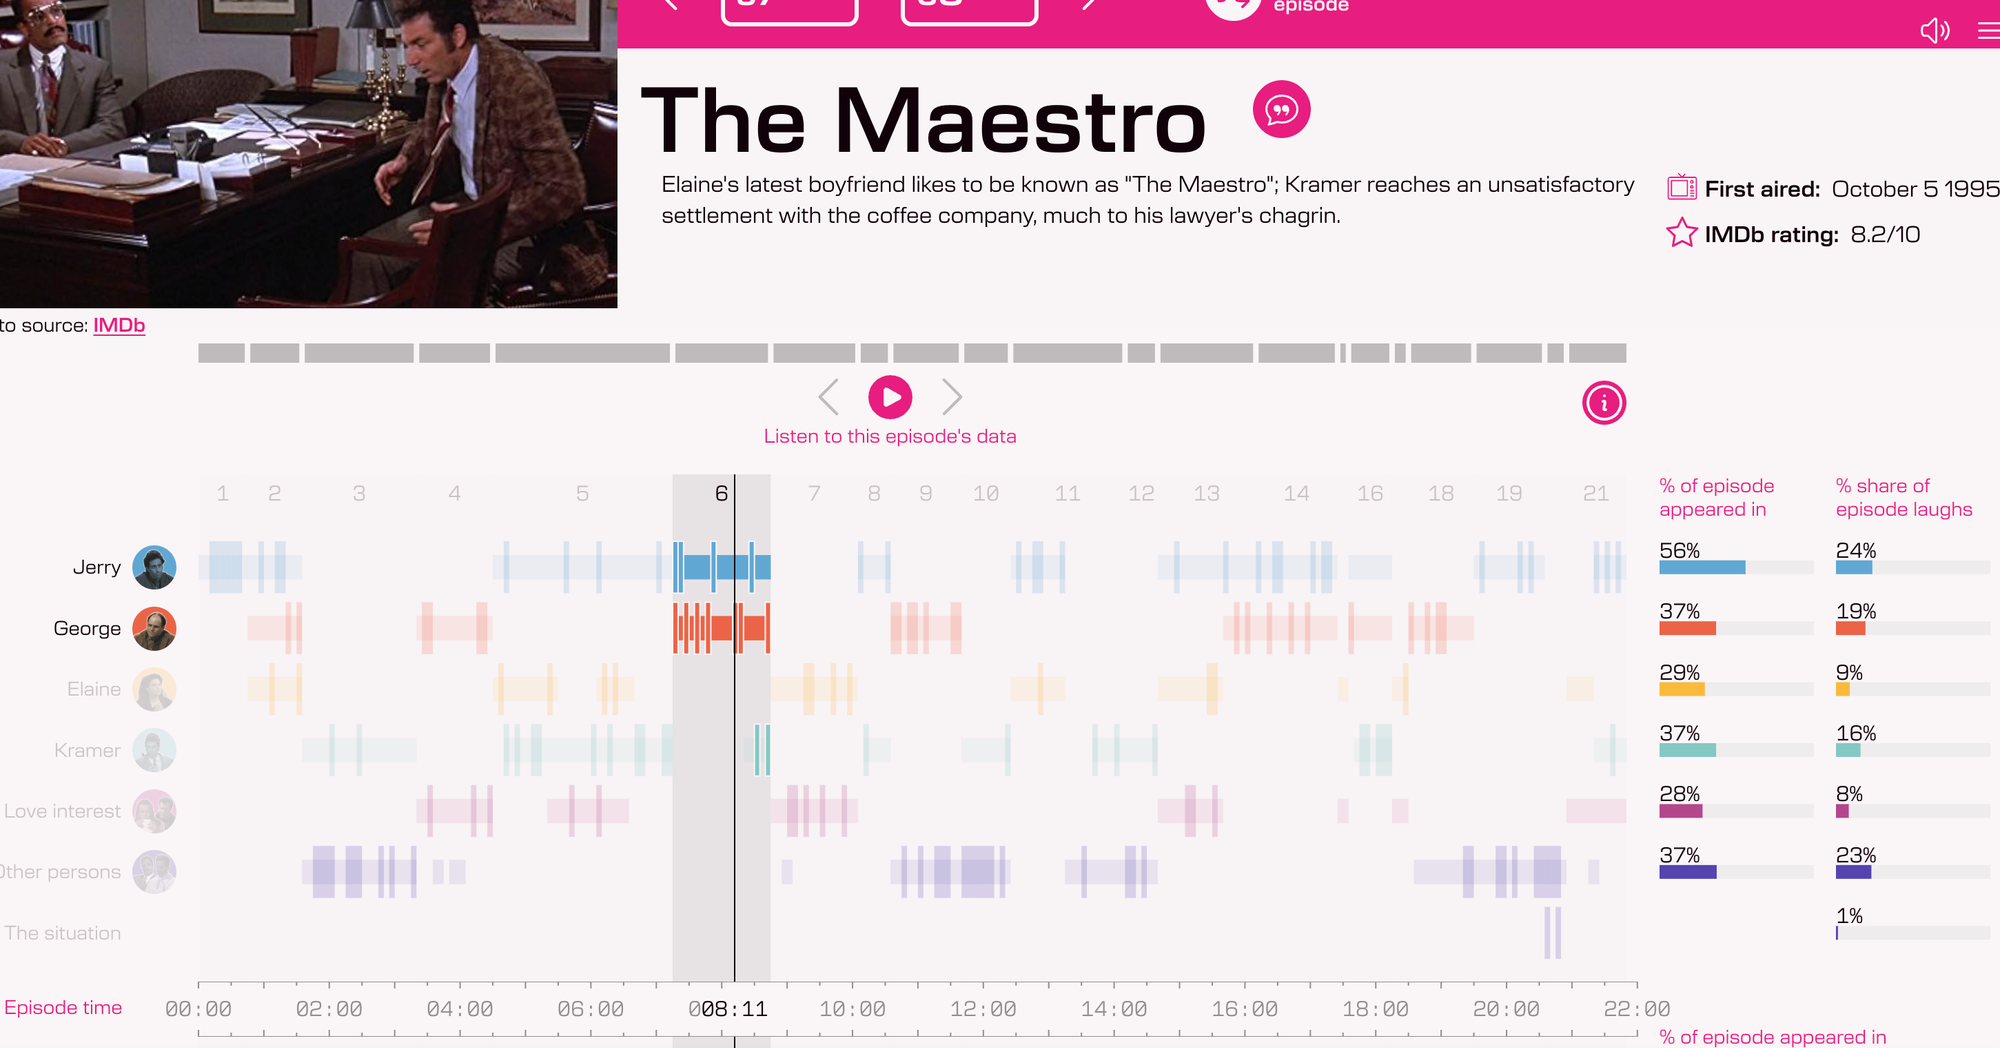
This is a delightful new interactive from my friends at Loud Numbers (Duncan Geere and Miriam Quick) collaborating with data viz personality Andy Kirk. The design and sonification of this piece is both incredibly fun and intuitive. For the sonification, each character is assigned an instrument from the iconic Seinfeld theme song. Across all 176 episodes, you see and hear the appearance of characters and the amount of laughs they generate in the story. Check out the Loud Numbers website for a full write-up on how it was made.
Dive Into a Very Noisy Sea With Some Very Rare Whales
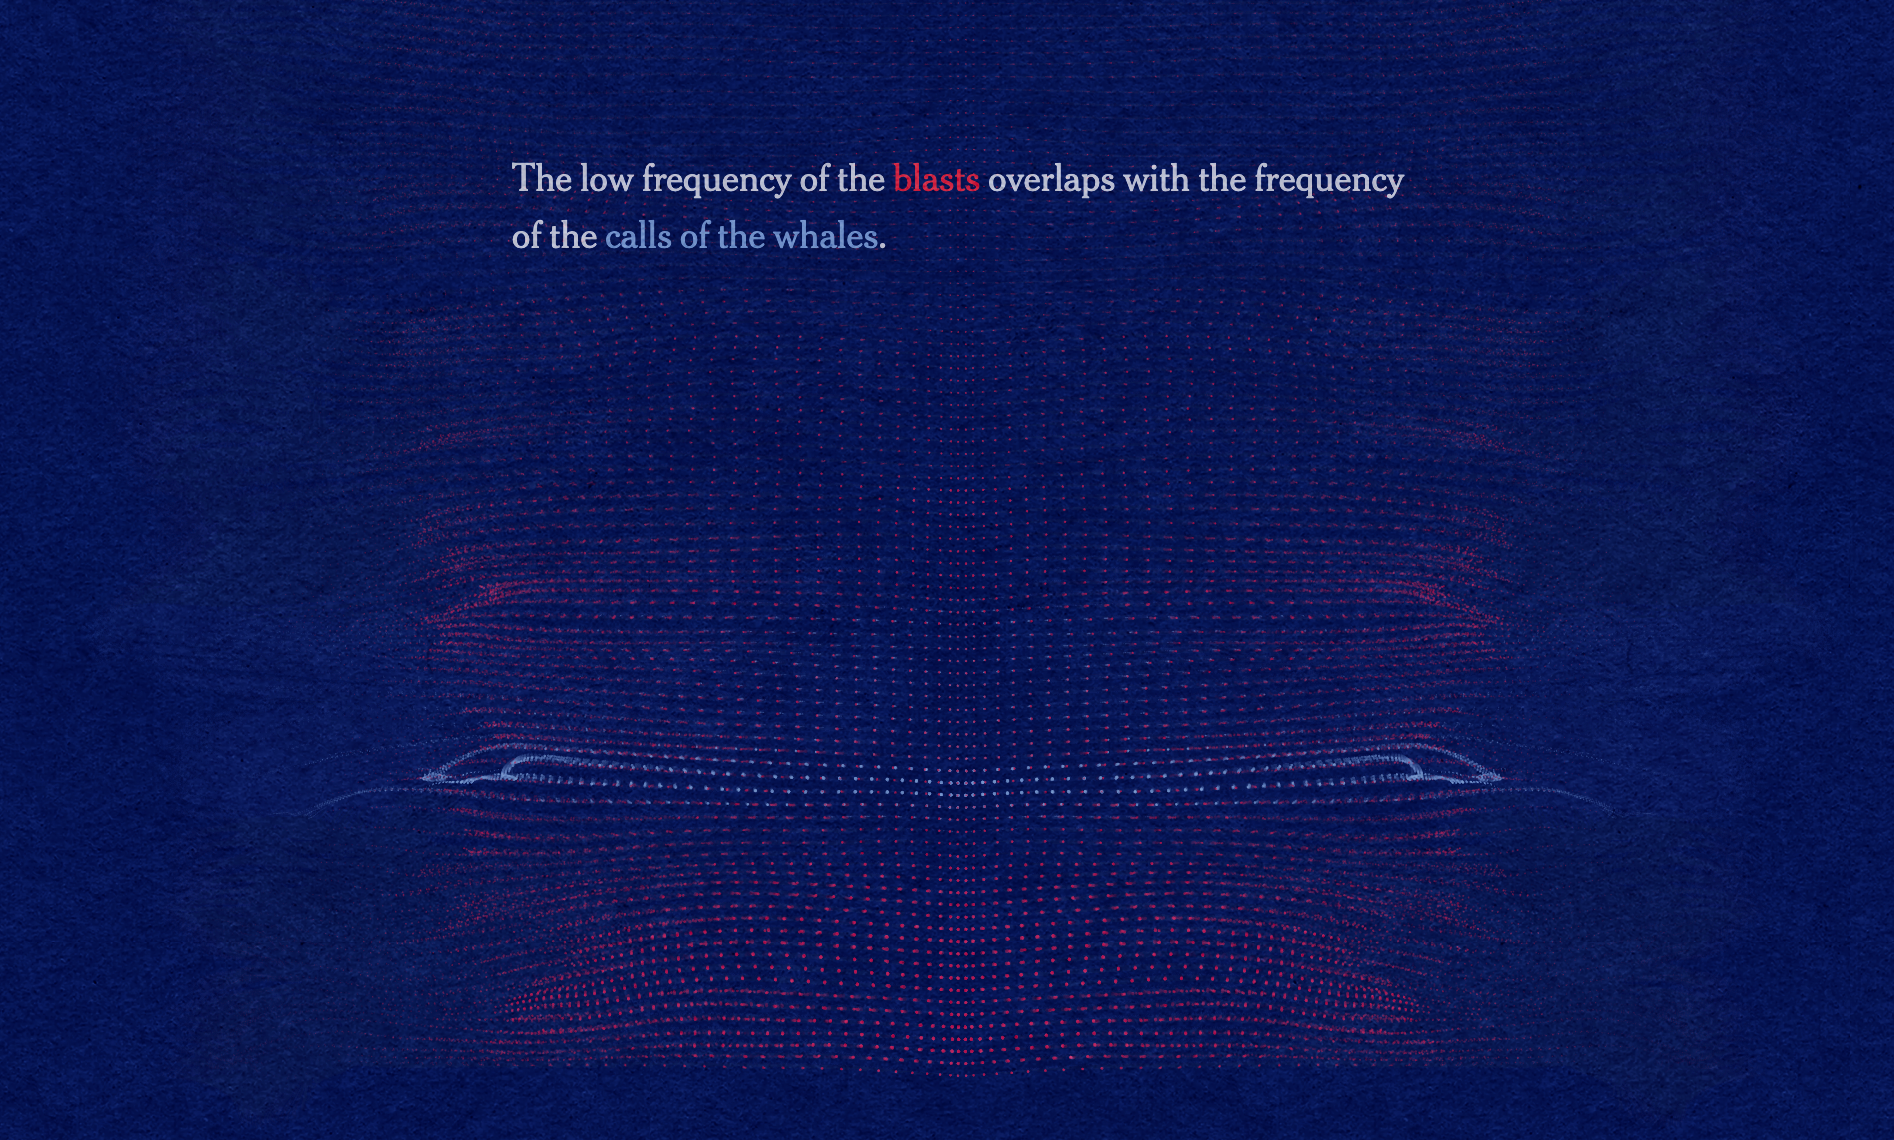
This is another "step-through" data viz story that I really like. The use of particles as a visualization of the whale calls combined with underwater air guns designed for oil mining is brilliant. I've thought about this theme a lot—what do other species hear? Our sonic perception is tied to size: humans hear sounds between 20hz - 20,000hz. But larger animals, like whales, have an entirely different sonic range. Our culture is so human-centric that we only consider the sounds we can hear. Meanwhile, underwater, whales are being blasted with frequencies that reduce how far there calls to other whales can travel, lost in a sea of noise. A good reminder to think about more than human rights.
I hope you're enjoying summer wherever you are. Will try to be back with another edition before the summer is over.
-Ben